


England Club Finances 2023/24 - from the Premier League to EFL League Two
catch these fists


After MPs voted to back the Football Governance Bill and establish an independent regulator to oversee the men's game in England, we thought it might be interesting to look at how the finances compare in the top four English leagues, ranging from the Premier League to League Two.
For each of the main financial metrics, we shall provide the details of each club in the 92, along with their individual ranking within the division.
In addition, we shall show the average, high and low for the division for the last available club accounts, which are from the 2023/24 season.
This piece includes a lot of valuable data, so is reserved for the top tier of subscribers, which we have rebranded as “I can expense this”, because it mainly includes people working at investment banks, private equity firms or consultancies, as well as senior executives in the football industry.
At the end of this article, you will find a couple of PDFs that can be downloaded containing all the data.
For anyone else who would like to access this post, the option to upgrade is always available!
England Overview
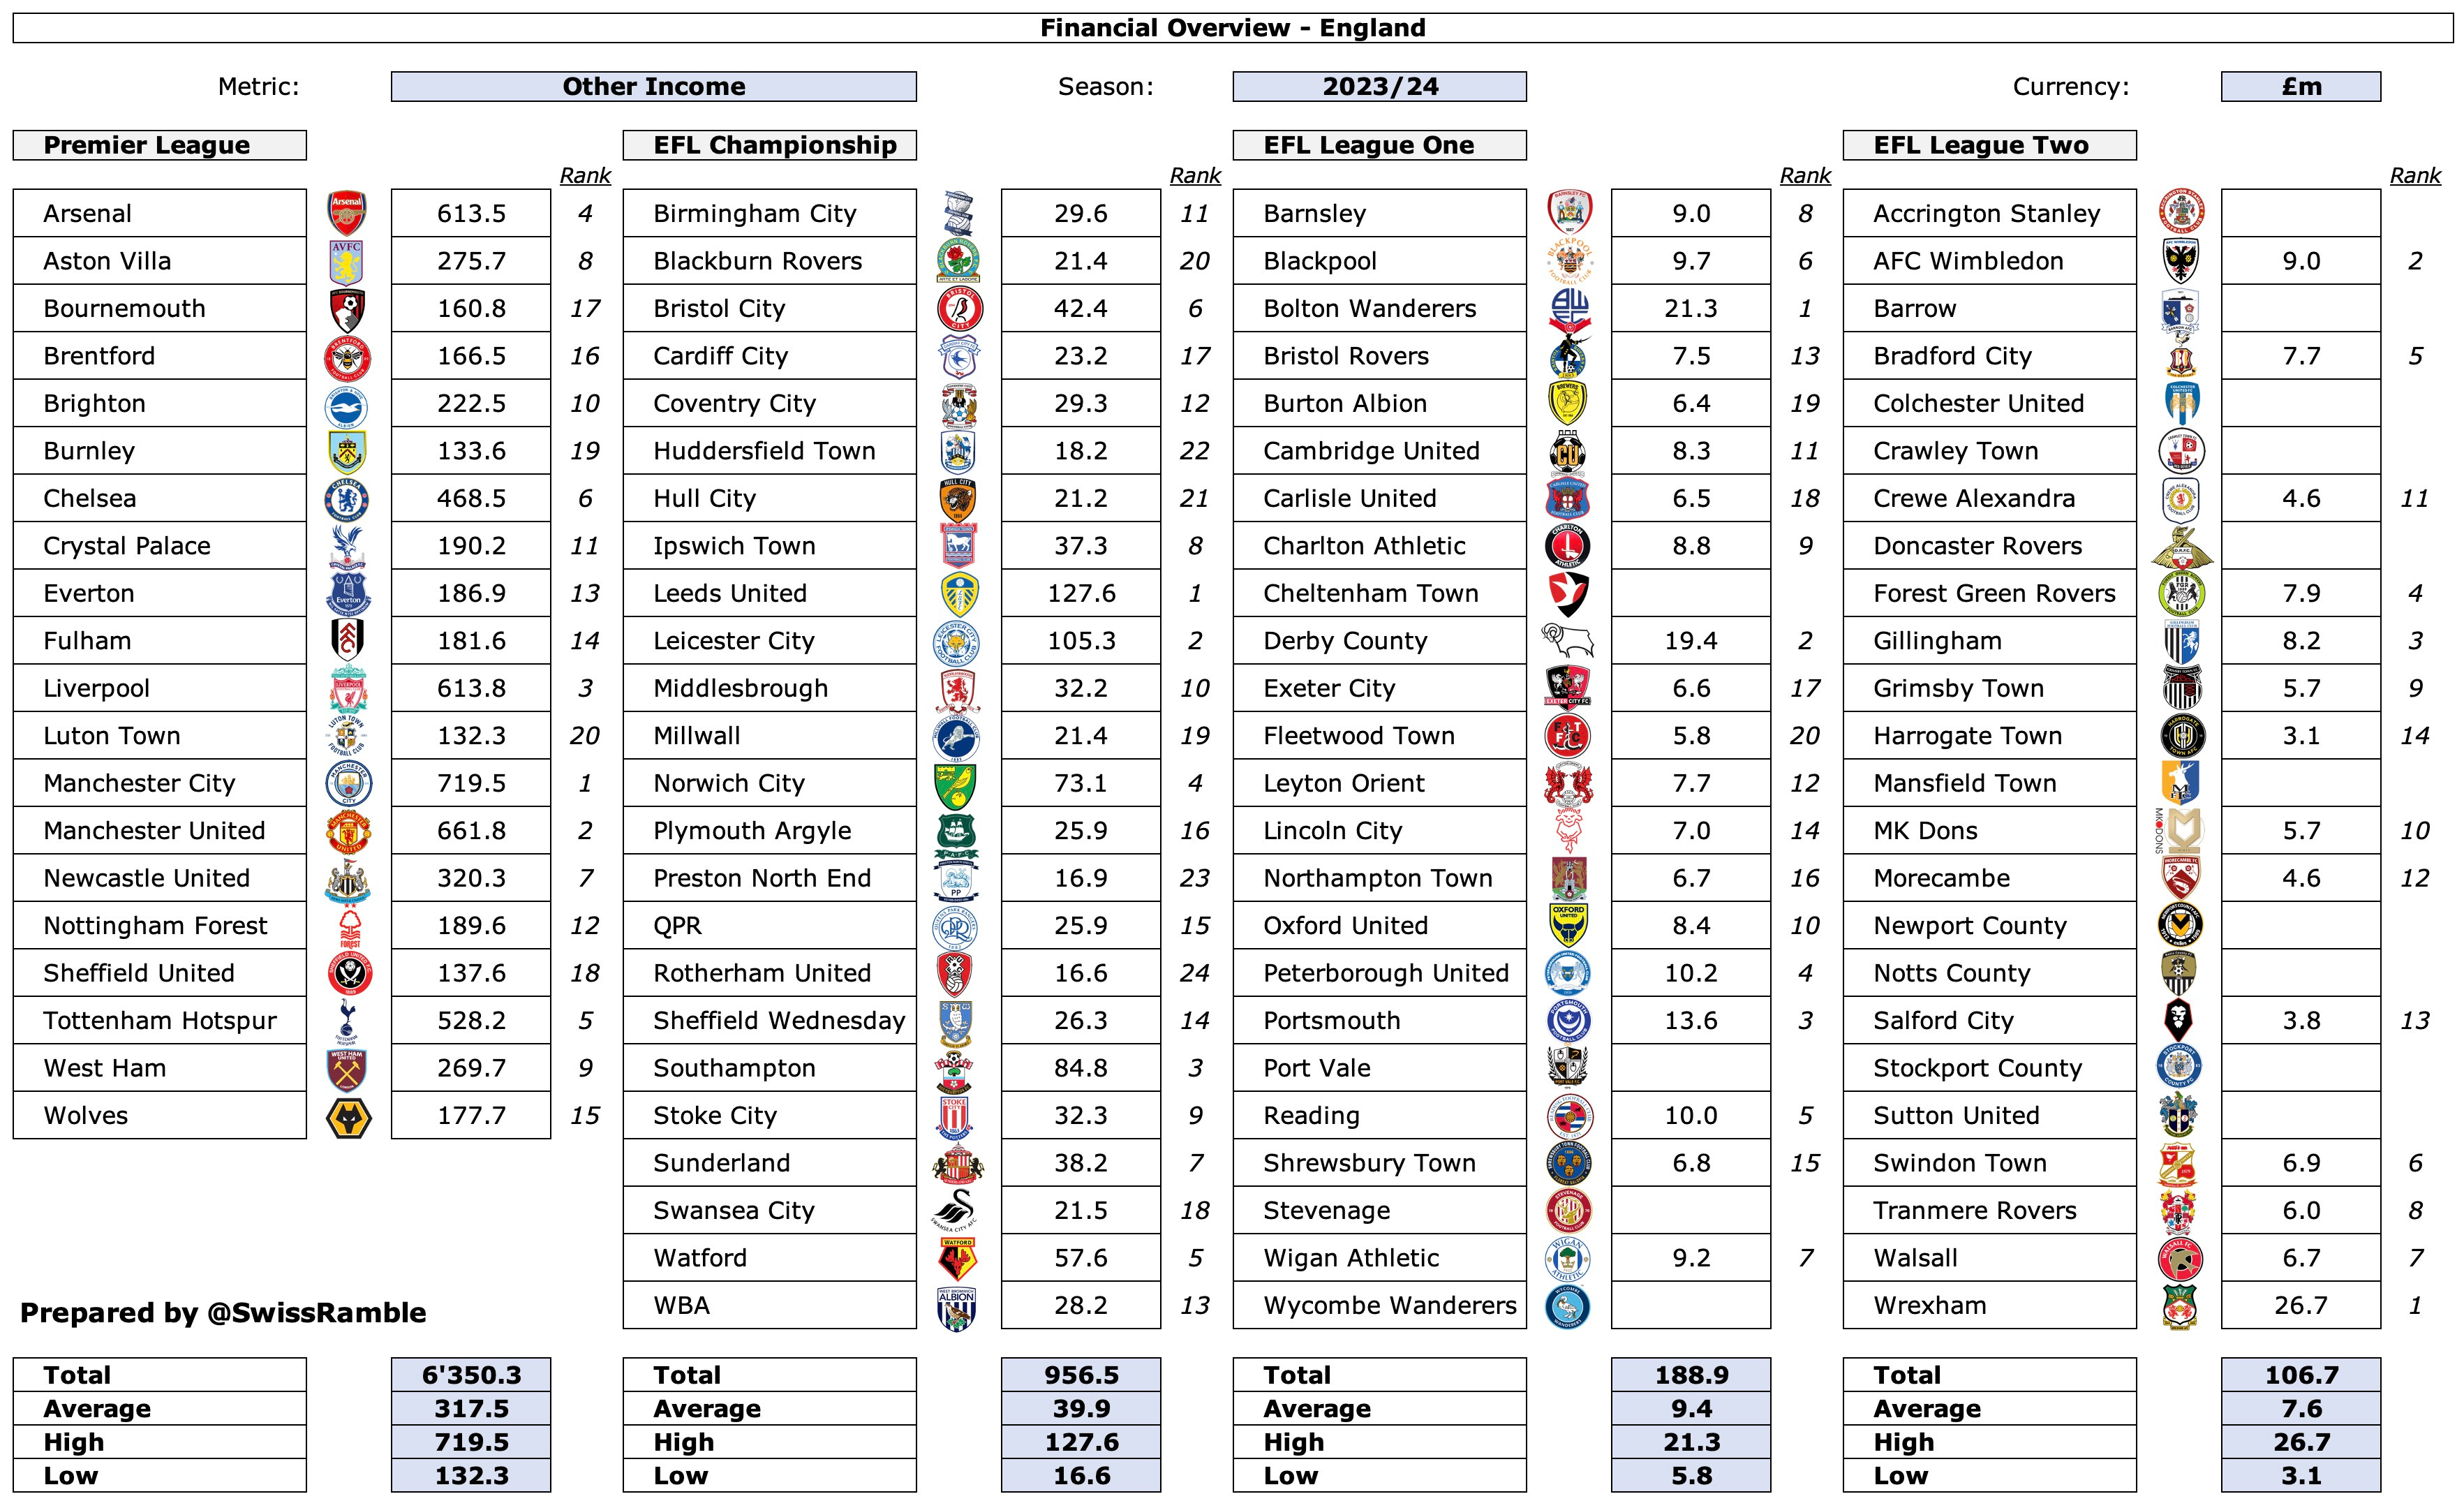
The handy one page summary looks like this:
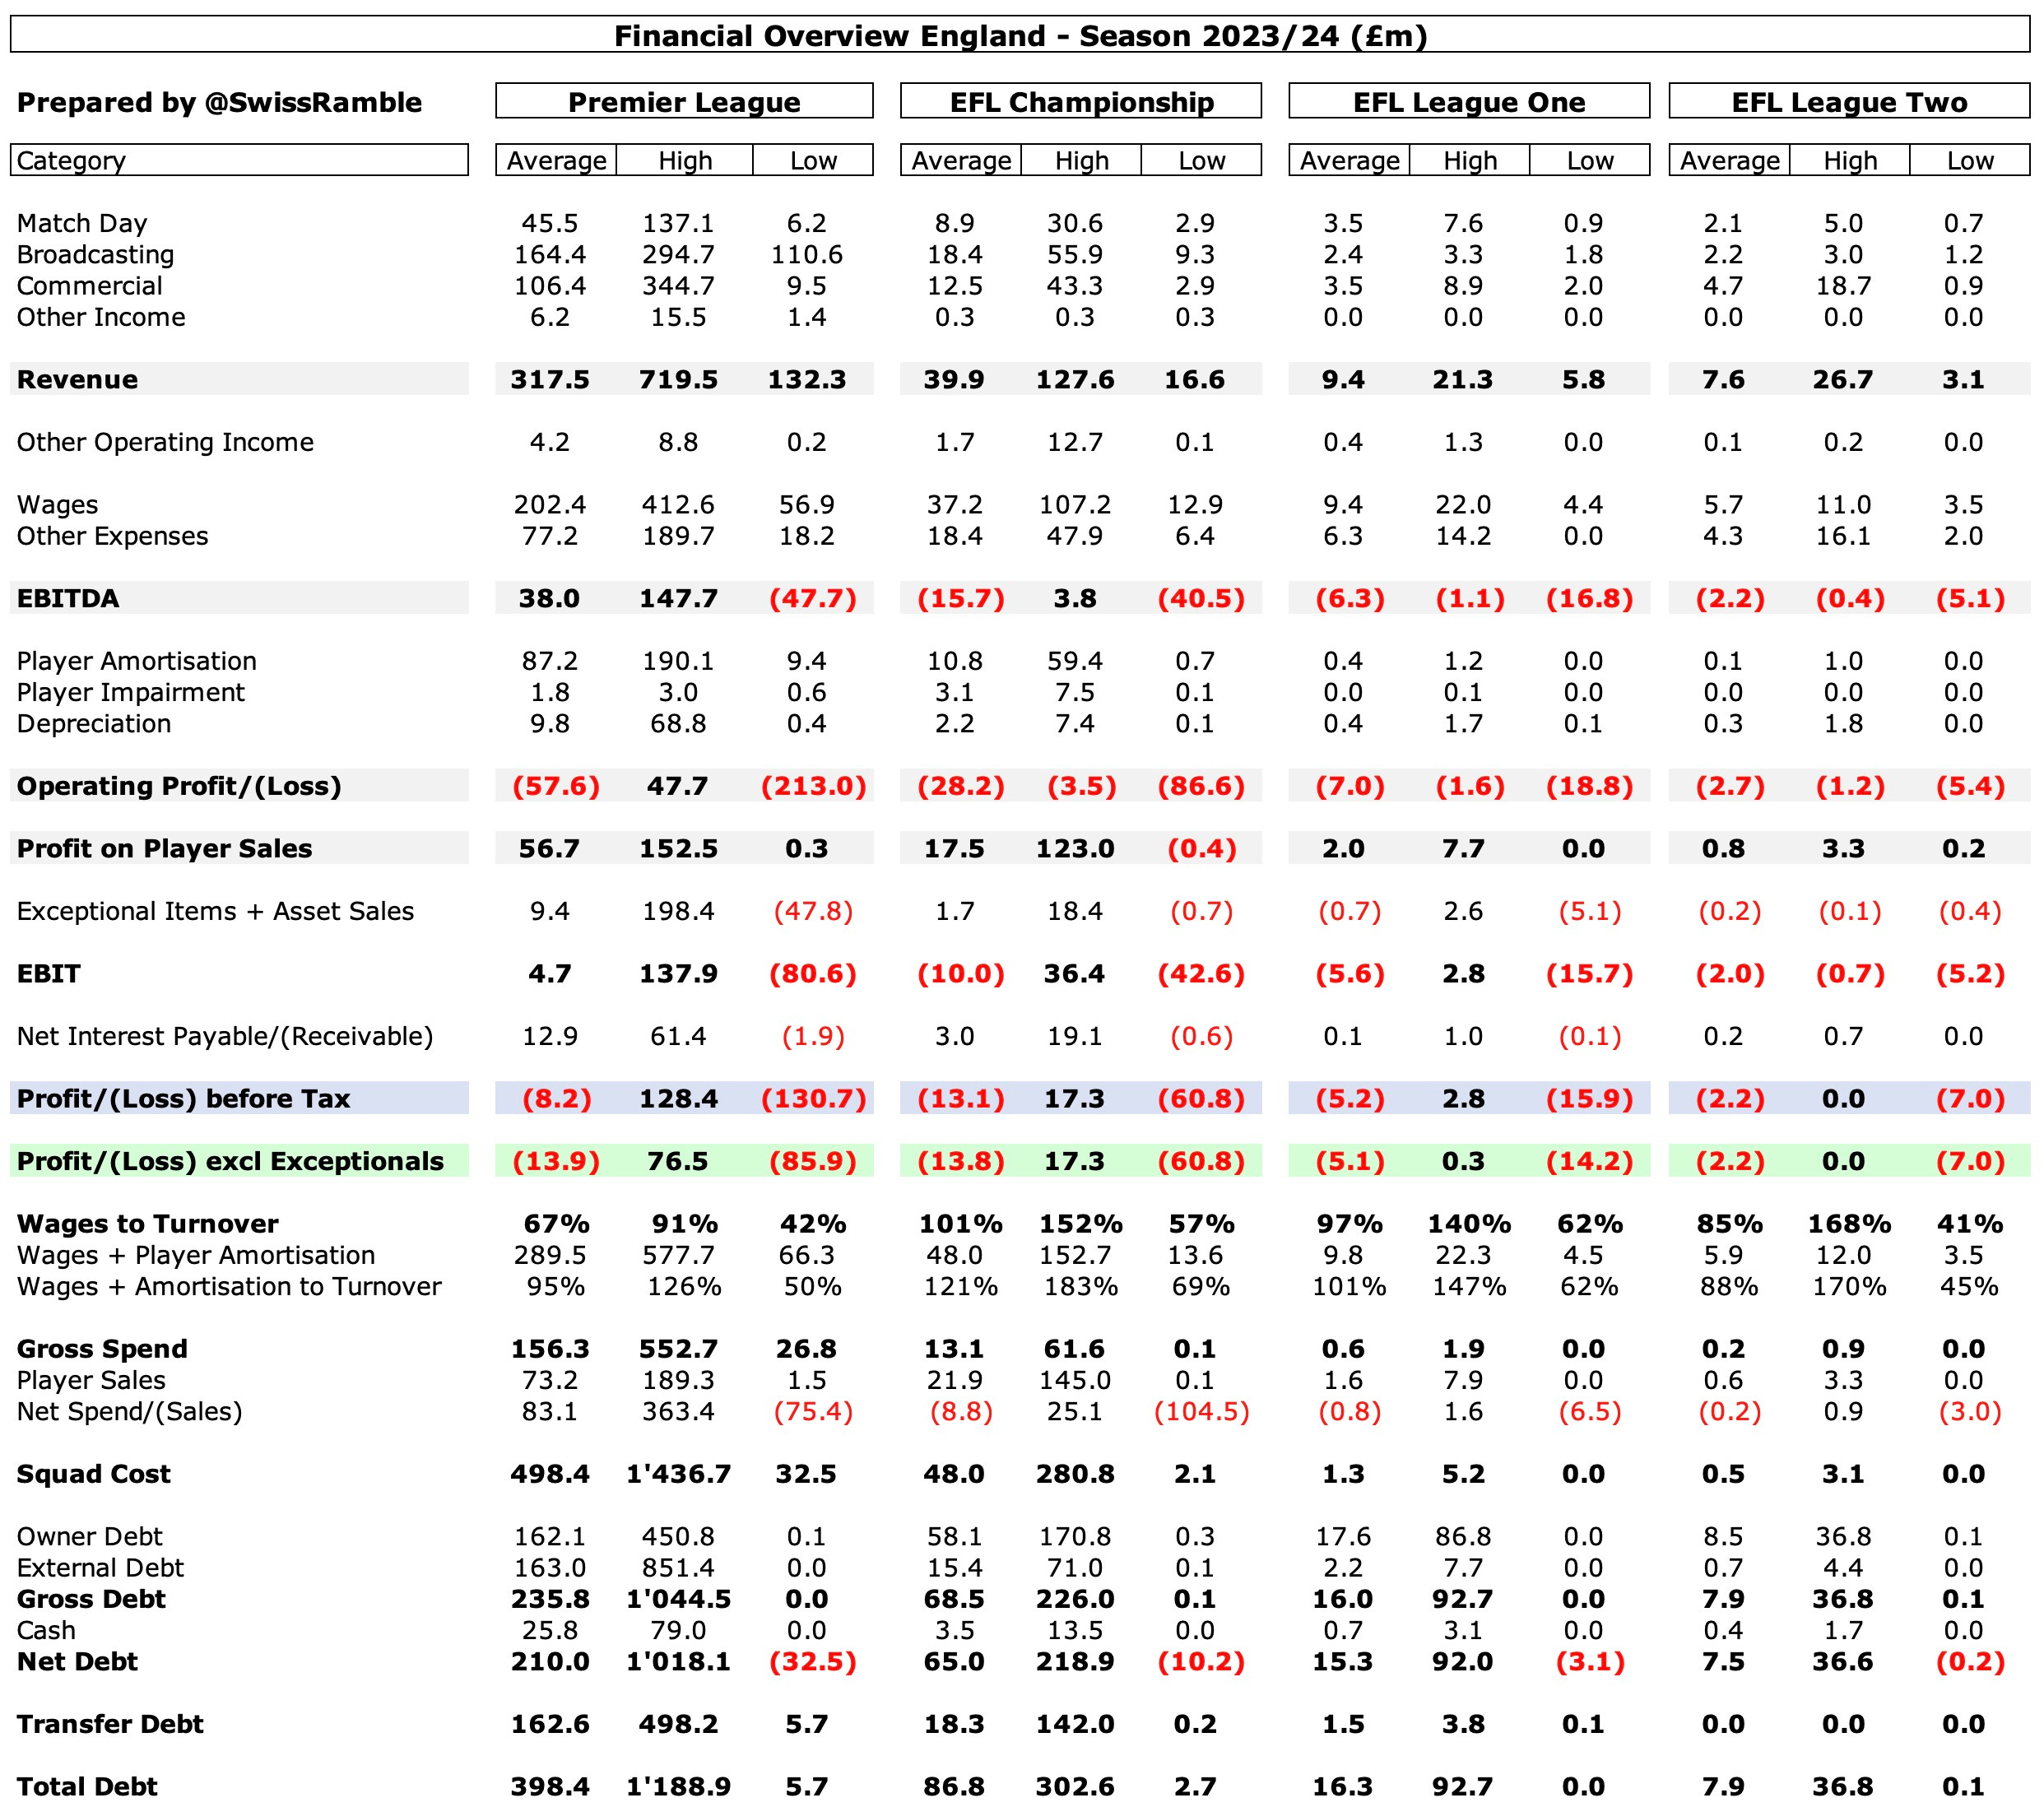
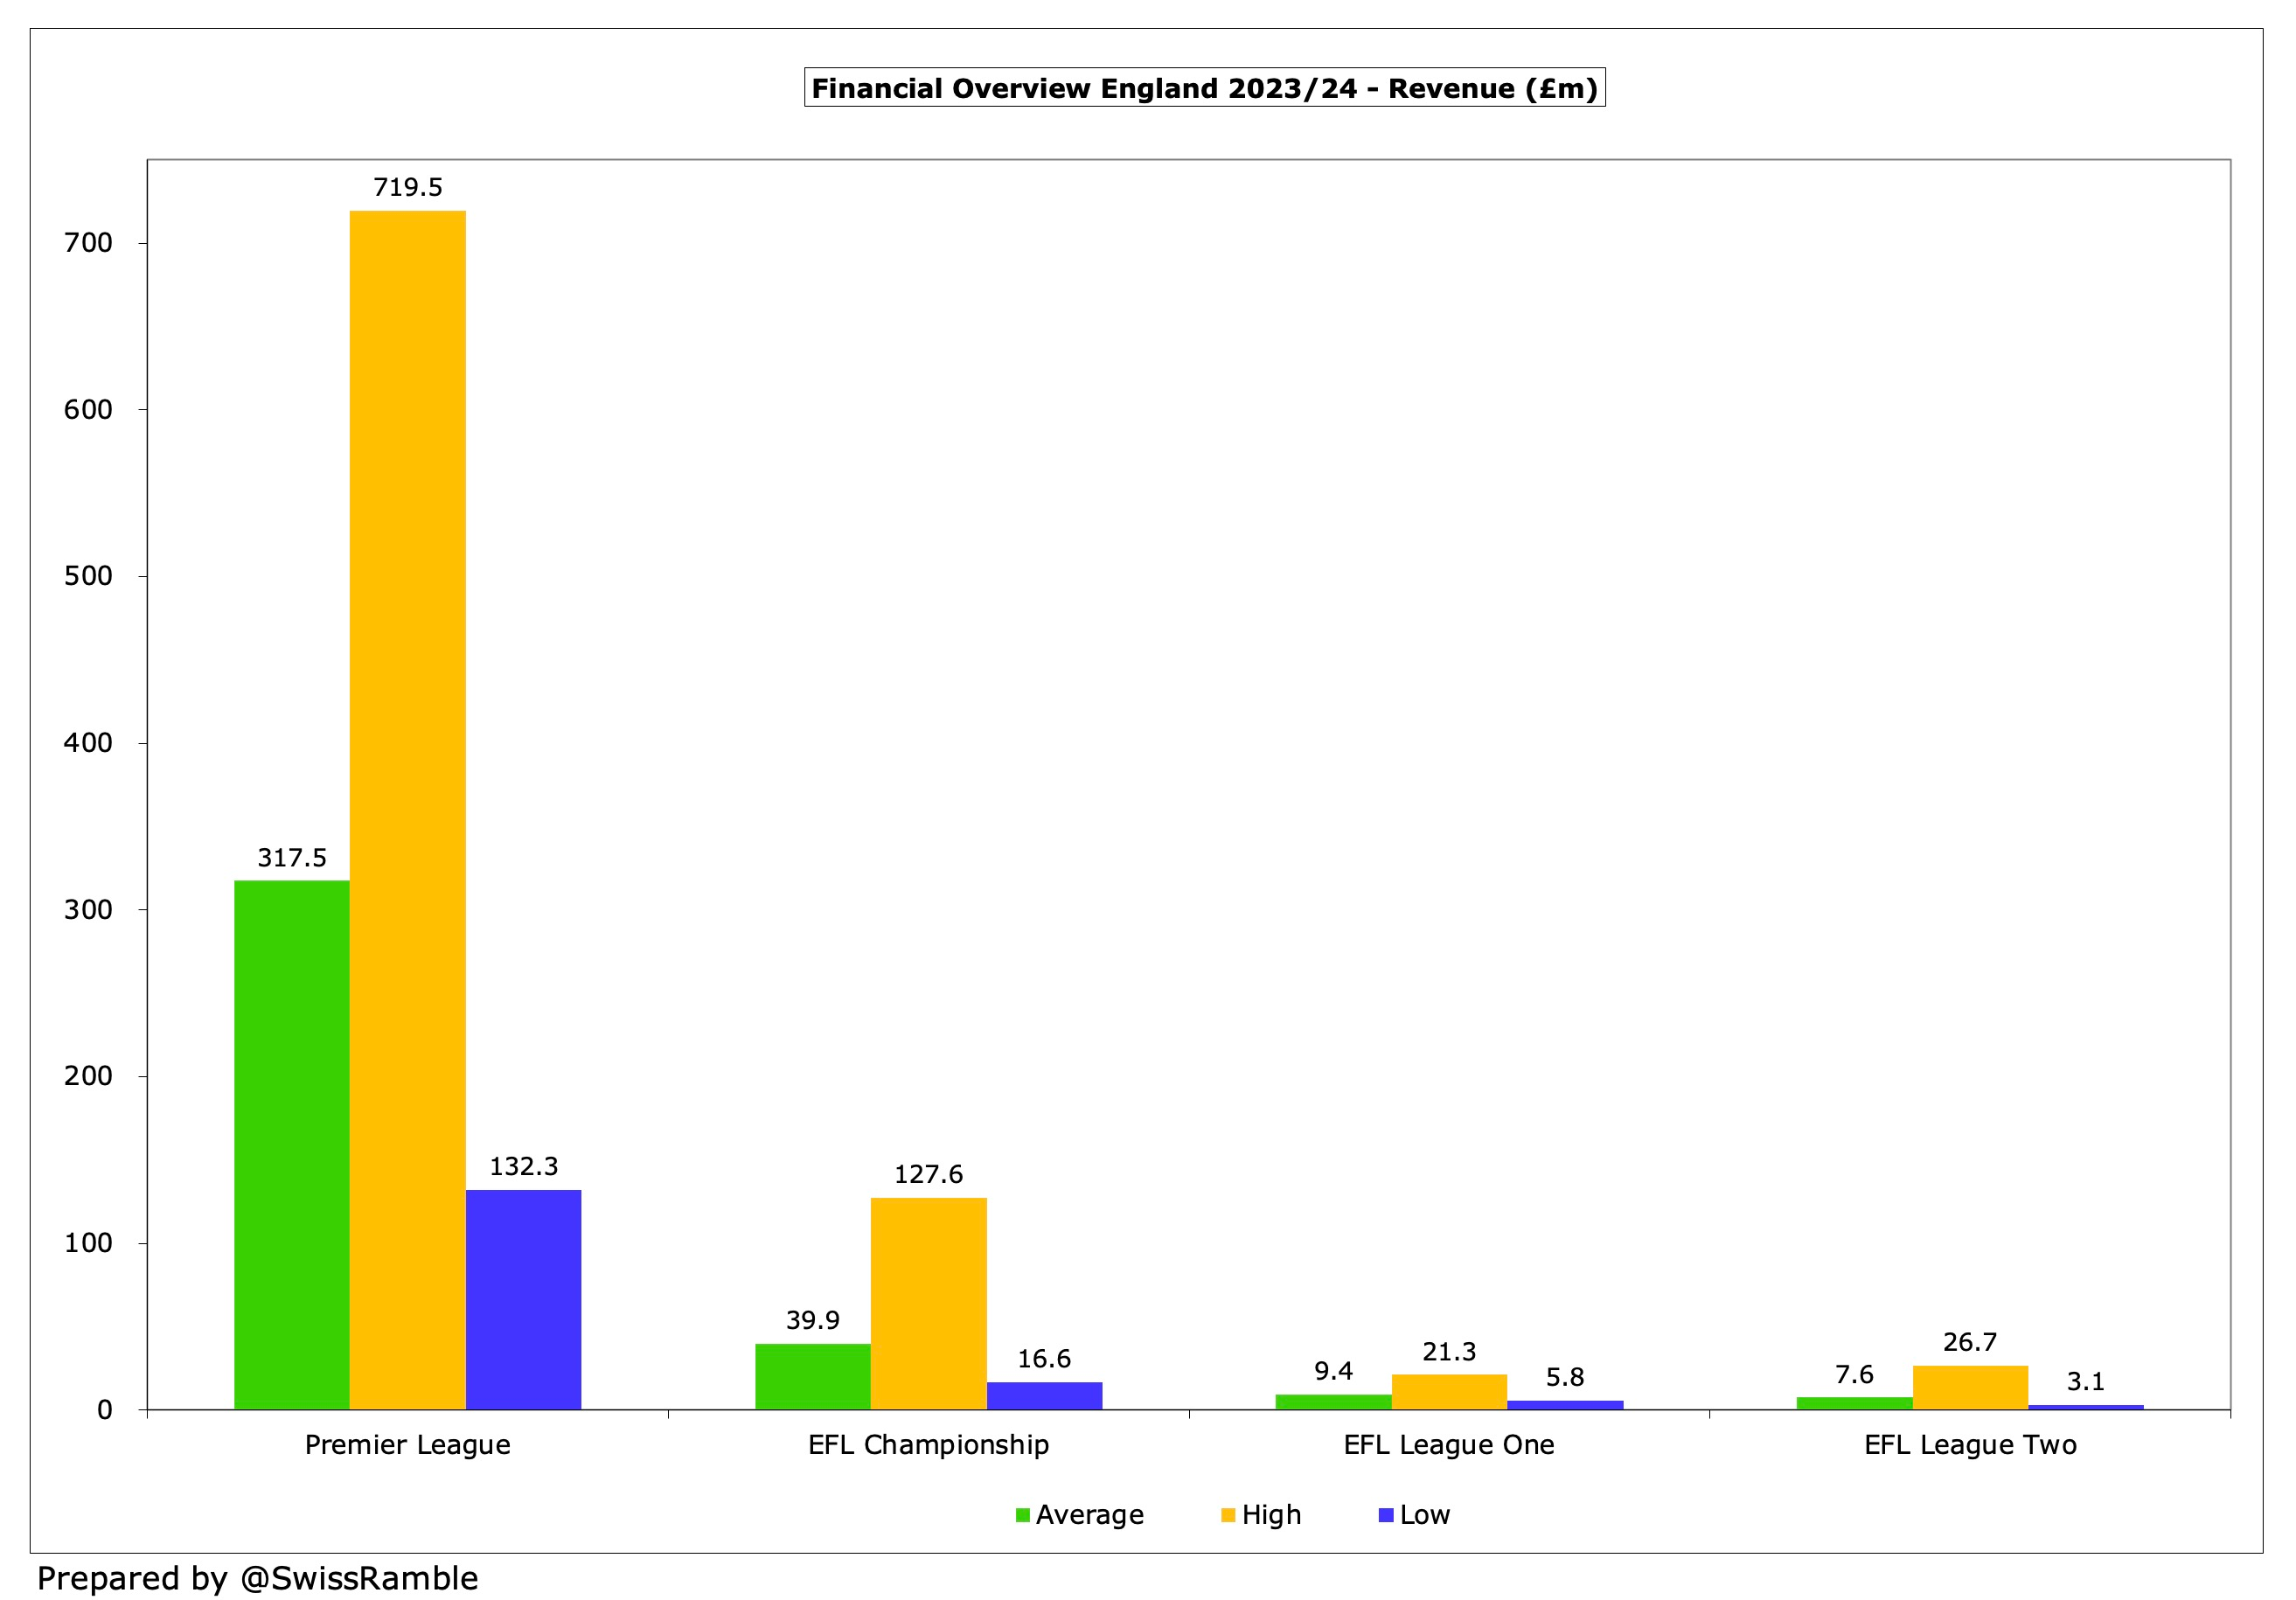
Taking revenue as an example, we can see that the average in the Premier League in 2023/24 was £317.5m, which was around eight times as much as the Championship £39.9m and massively higher than League One £9.4m and League Two £7.6m.
However, there was also significant disparity within each division, so revenue in the Premier League ranges from £719.5m to £132.3m, while it’s the same story in League Two, albeit with much lower figures, going from £26.7m to £3.1m.
Divisional Overviews
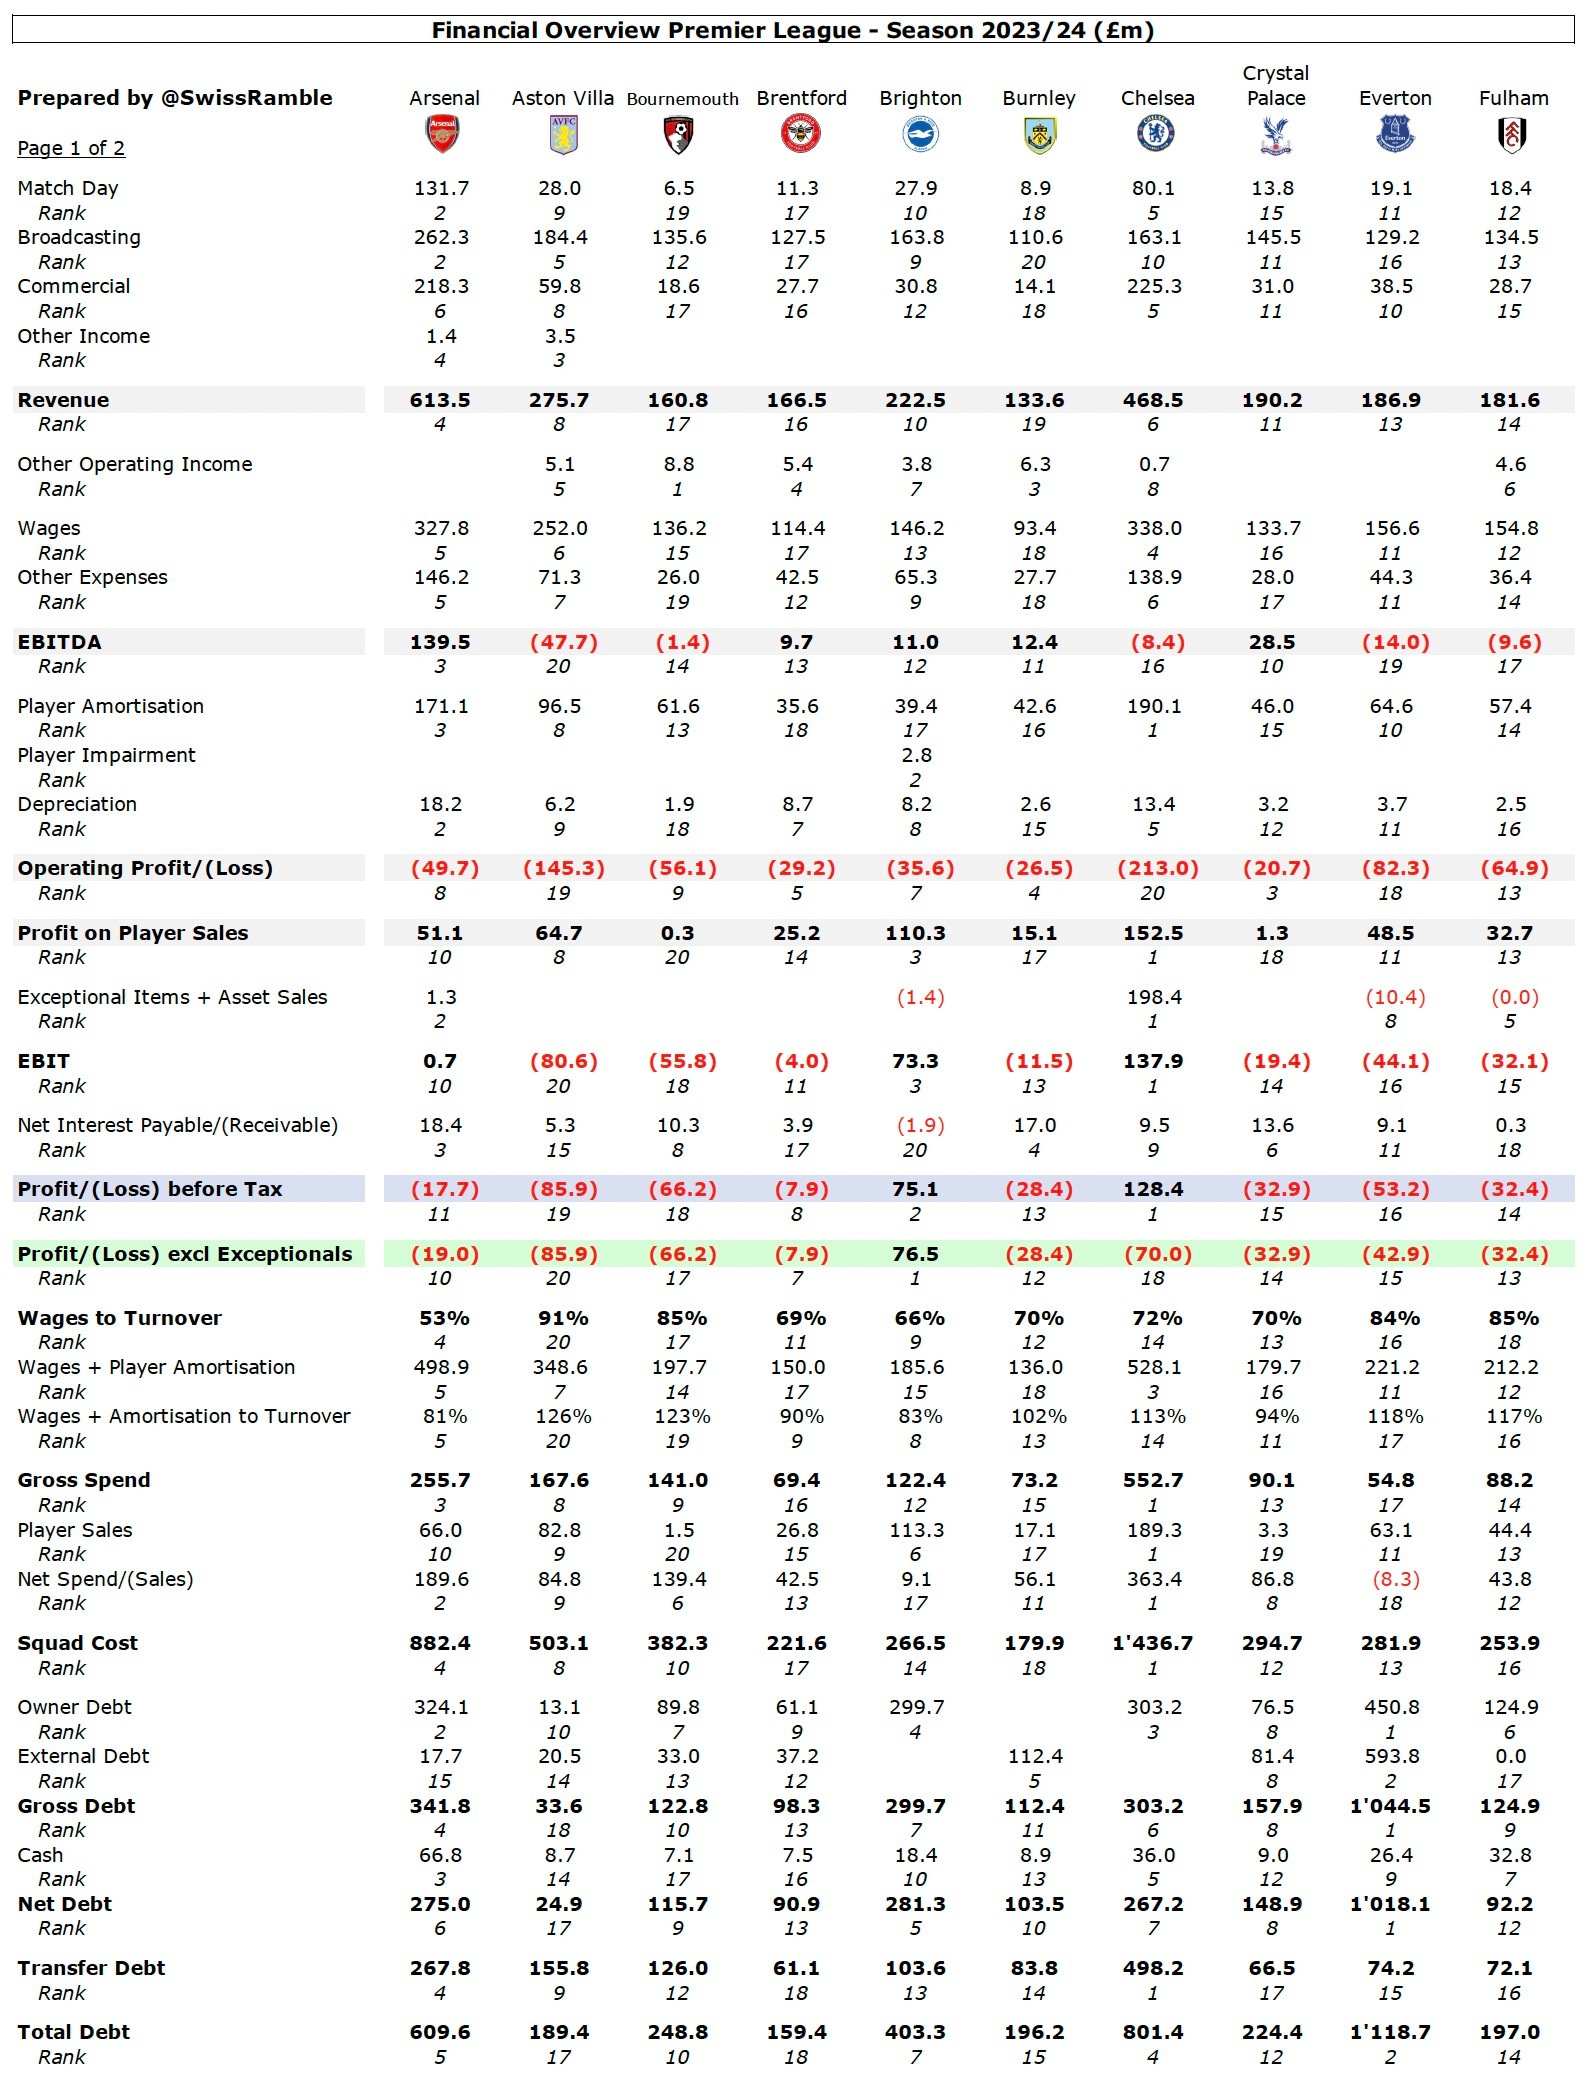
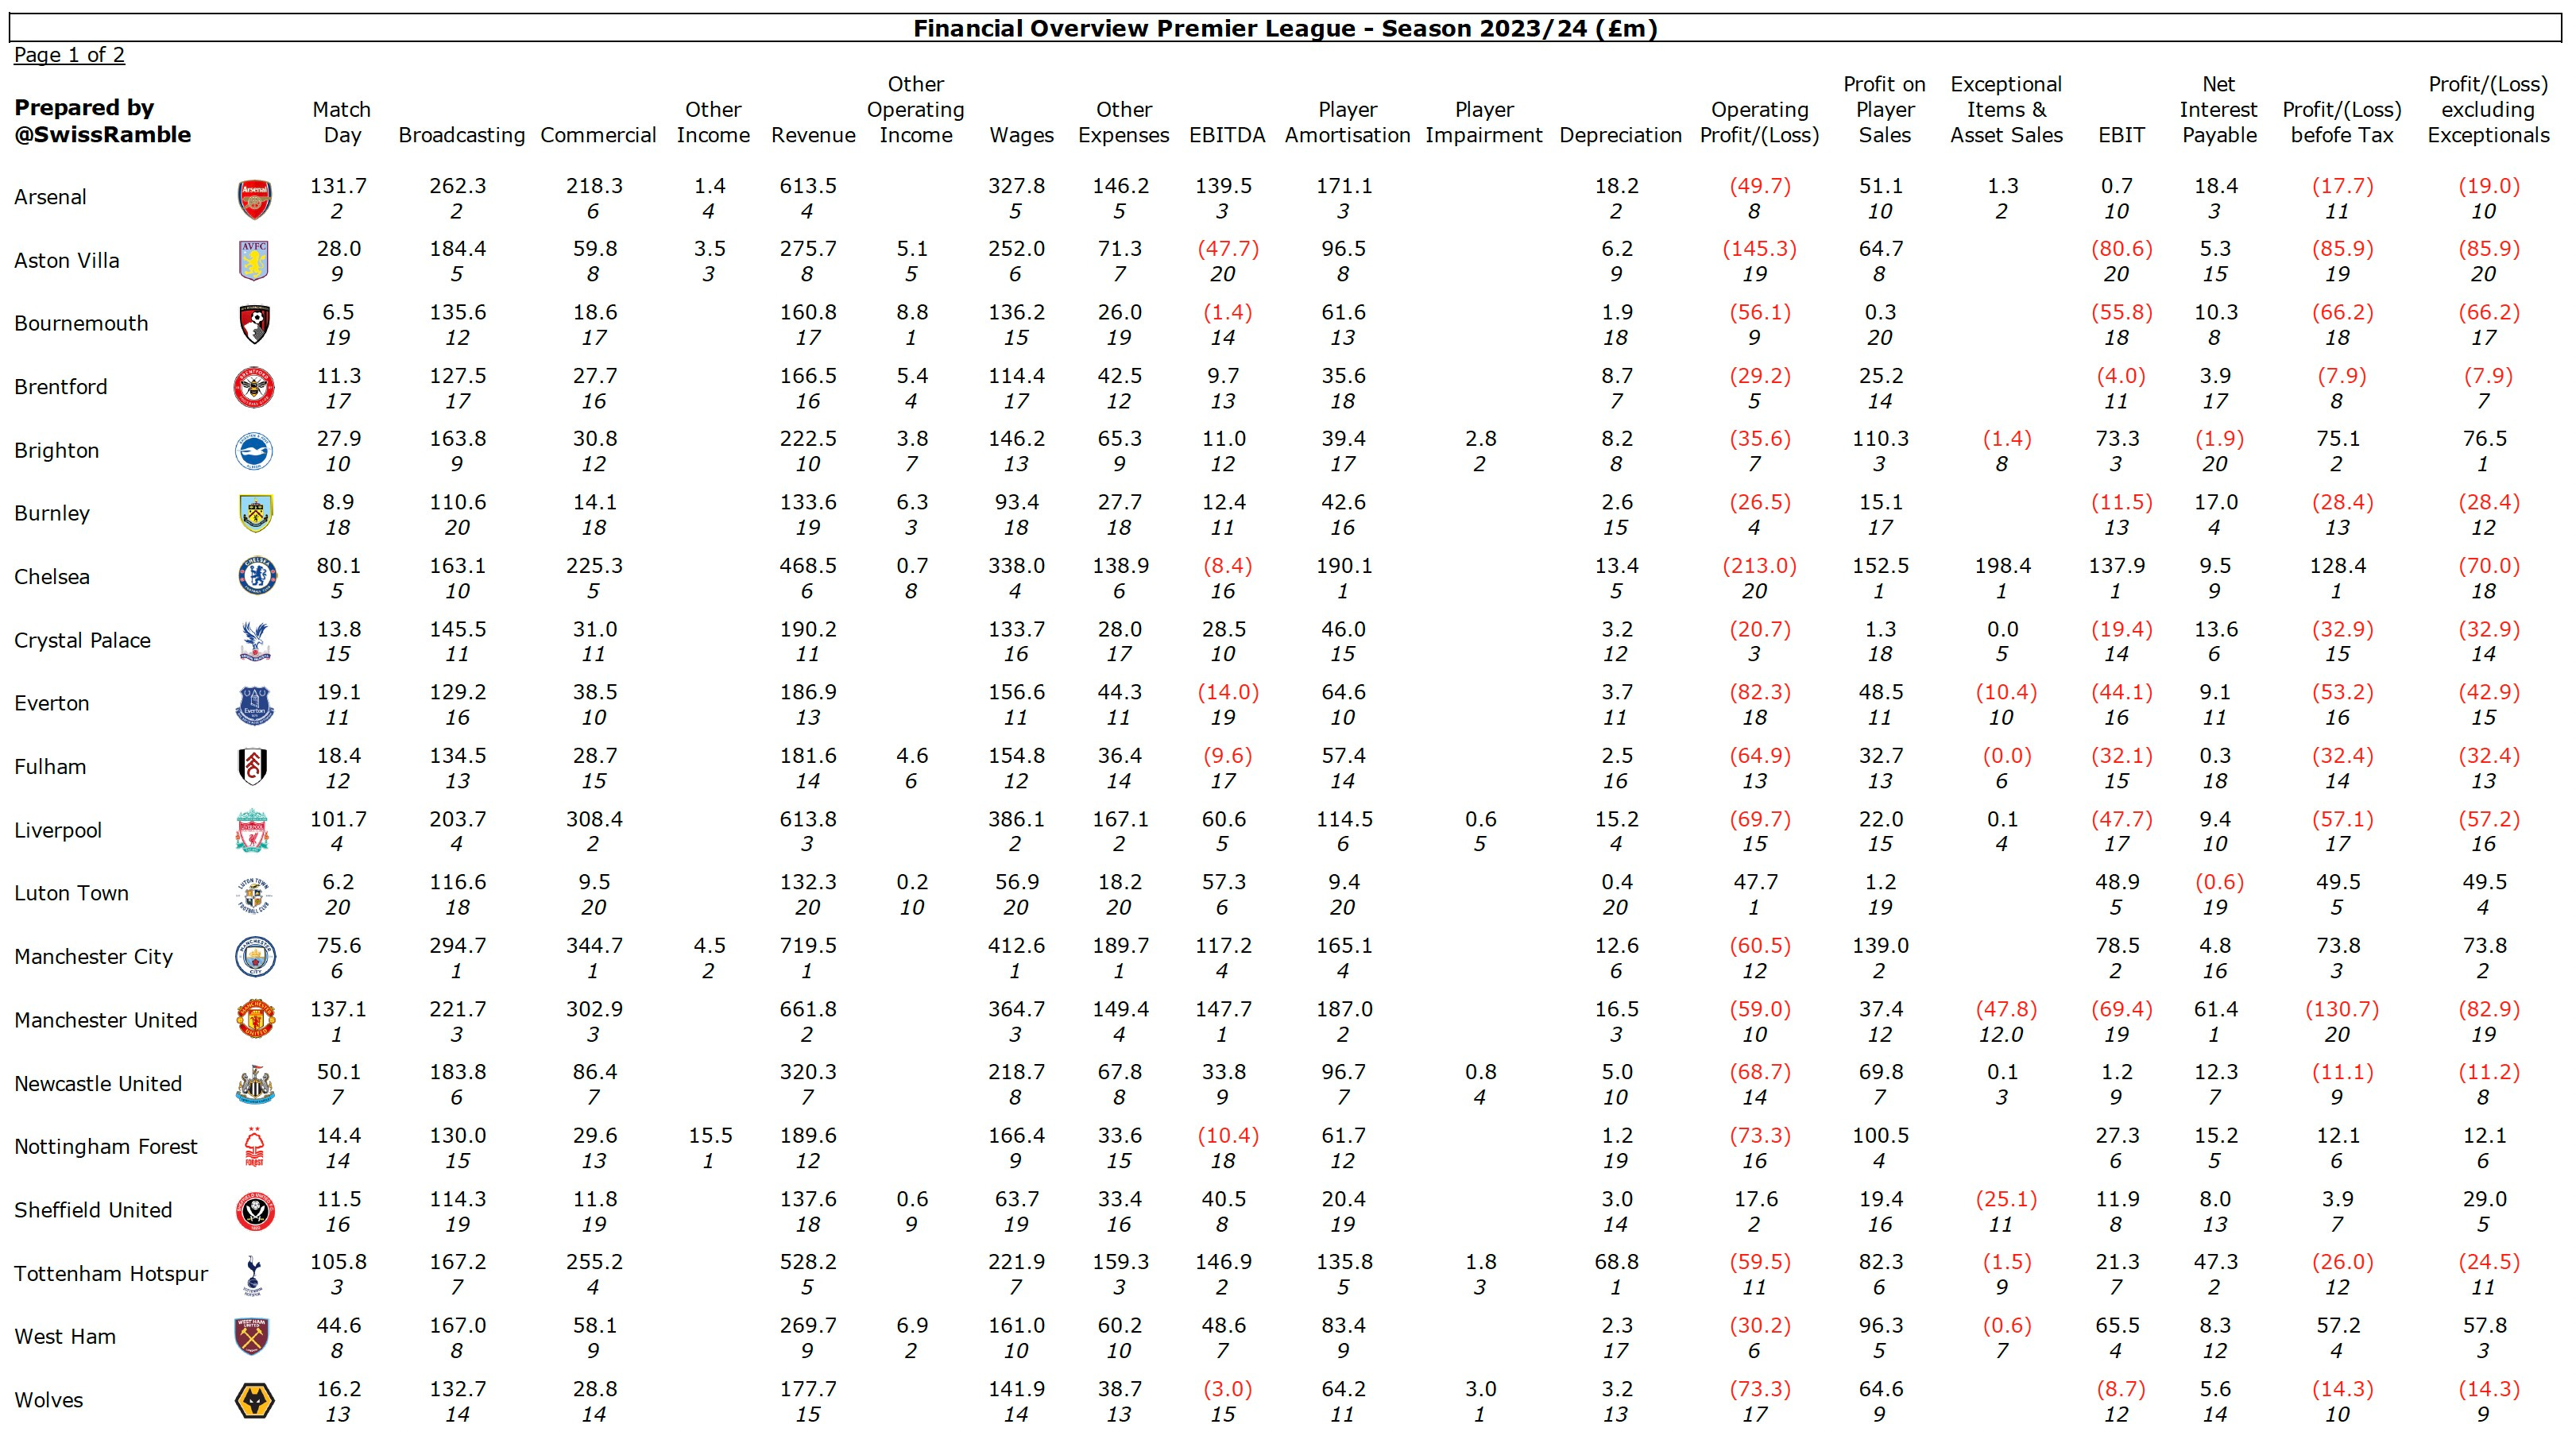
For each of the four divisions, we have then provided overviews that include the data for all of the clubs, along with their ranking.
These have been split into two pages, as a one pager would have been almost impossible to read.
Two versions have been provided, depending on your preference:
Portrait view – shows all the metrics, with the clubs split over two pages.
Landscape view – shows all the clubs, with the metrics split over two pages.
Rules of the Road
Unfortunately, not every club in England publishes detailed accounts, so complete data is not always available for a metric, especially in League One and League Two.
In such cases, the averages have been calculated based only on the number of clubs that have provided data.
Similarly, the rankings have only been applied where data is available, e.g. if only 15 clubs have published data, the ranking goes from 1st to 15th.
Overview by Financial Metric
Each financial metric has:
A graph, showing the average/high/low by division.
A table, showing the details for each club (plus ranking within the division).
Revenue
As we have seen, there is an enormous difference in revenue between the divisions, which is one of the many issues that the independent football regulator is likely to review.
This has numerous implications, including competitive imbalance and financial sustainability. In particular, it encourages clubs to over-spend (lose money) in order to improve their chances of securing promotion.
Even in the Premier League, there is a clear division between the Big Six and other clubs, while within that cohort the Champions League representatives have an advantage.
It is worth noting that Wrexham not only had the highest revenue by far in League Two, but they also generated more than every club in League One and 11 clubs in the Championship.
Match Day Revenue
Average match day income underlines the divisional differences: Premier League £45.5m, Championship £8.9m, League One £3.5m and League Two £2.1m.

Four English clubs generated more than £100m in match day income, namely Manchester United £137m, Arsenal £132m, Tottenham £106m and Liverpool £102m, but at the other end of the spectrum three Premier League clubs had less than £10m.